Handwriting Recognition Using Deep Learning
Description
Recognizing Handwritten Text in Physical Documents
Introduction
Recognizing handwritten text is one of the most well-known and long-studied tasks in machine learning. In fact, when the CNN was created by Yann LeCun, recognizing handwritten digits was its first task, with the MNIST dataset being used. However, in this project, director Justin Tran and his team present a solution to this problem of Handwritten Text Recognition (HTR) that significantly outperforms prior state-of-the-art models, all without the use of convolutional neural networks.
Recognizing written text is integral to digitizing documents in industries like healthcare, insurance, and banking. However, the biggest challenge is in the high variation of writing styles, and though many software applications already possess HTR features, they are far from perfect. Active research is still ongoing in this field, and with continuous advancements comes many more streamlined processes across numerous fields that rely upon this technology.
Framework
Dataset

The IAM dataset was used to train and test the model. It includes 13,353 images of lines of handwritten text, which are used as the inputs to the HTR algorithm (word and document levels are also provided). Given a document, the bounding boxes for them are also provided and were used to train the segmentation step of the model.
Architecture
Network Structure (Segmentation)

The algorithm used to perform word segmentation is based on the paper ‘Scale Space Techniques for Word Segmentation in Handwritten Documents’. The algorithm proposed in the paper considers the scale-space behavior of blobs in images containing lines. The underlying concept of this algorithm is the utilization of Gaussian filters to generate an image’s scale space, which involves developing a family of signals where details are progressively removed.
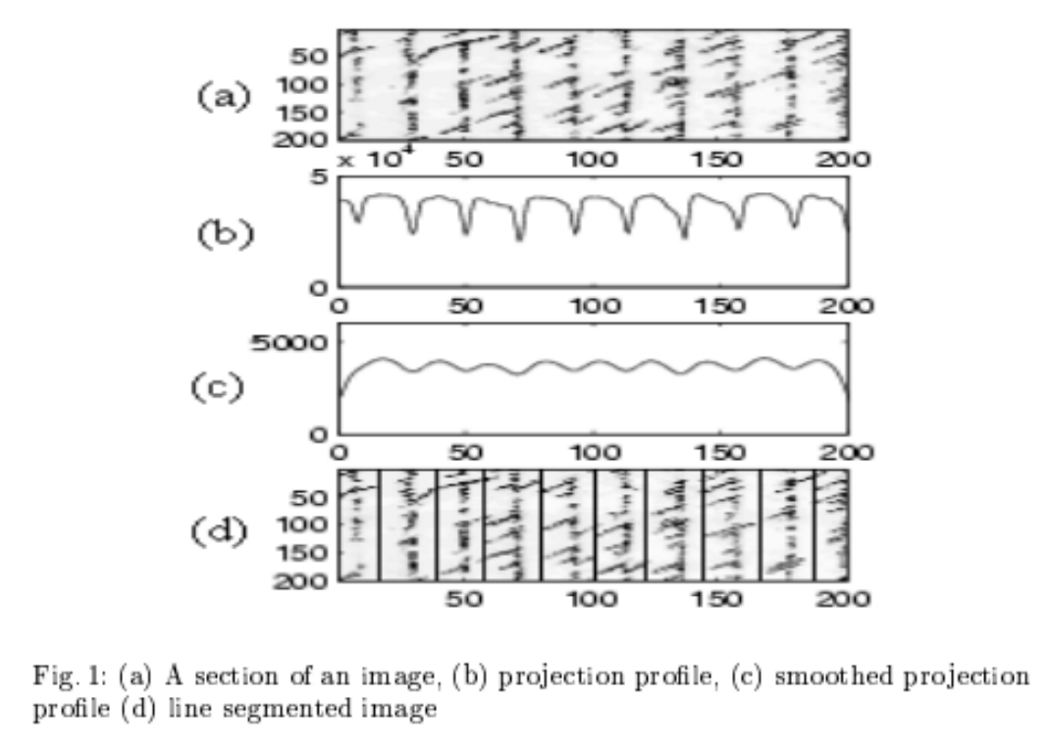
In order to accurately segment the lines within a document, projection profile techniques were utilized. The vertical projection profile is defined by summing the pixel intensity values along a particular row. The lines are identified by determining local peaks in the projection profiles after applying Gaussian smoothing to deal with false positives. After line segmentation, second-order differential Gaussian filters are applied along both orientations of the image in order to form a blob (a connected region) representation of the image. By convolving the image with the second-order differential Gaussian, a scale-space representation is created. The blobs in this representation appear brighter or darker than the background after this convolution. By altering the parameters of the filters, the blobs will transition from characters to words.
Network Structure (Classification)

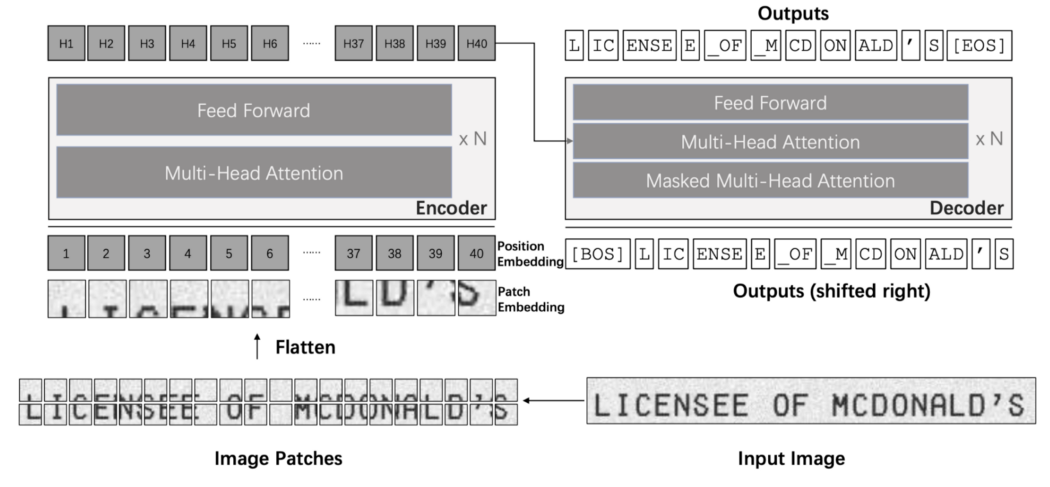
The architecture used was based on the paper “TrOCR: Transformer-based Optical Character Recognition with Pre-trained Models” by Li et al. [2]. The architecture for classification was implemented after the segmentation step. It is composed of an encoder and a decoder. The image is first resized and broken into a batch of smaller 16x16 patches, which are then flattened to form what we call patch embeddings. Based on the position of each patch, they are also given a position embedding. These inputs are then passed into a stack of encoders composed of a multi-head self-attention module and a feed-forward network.
The outputs of the encoder are then fed into a decoder architecture, which is almost the same as the encoder architecture. The difference lies in adding an “encoder-decoder” attention module between the two original encoder components. The embedding from the decoder is then projected into the size of the vocabulary, and after applying the softmax function and beam search, the final output is determined.
Results

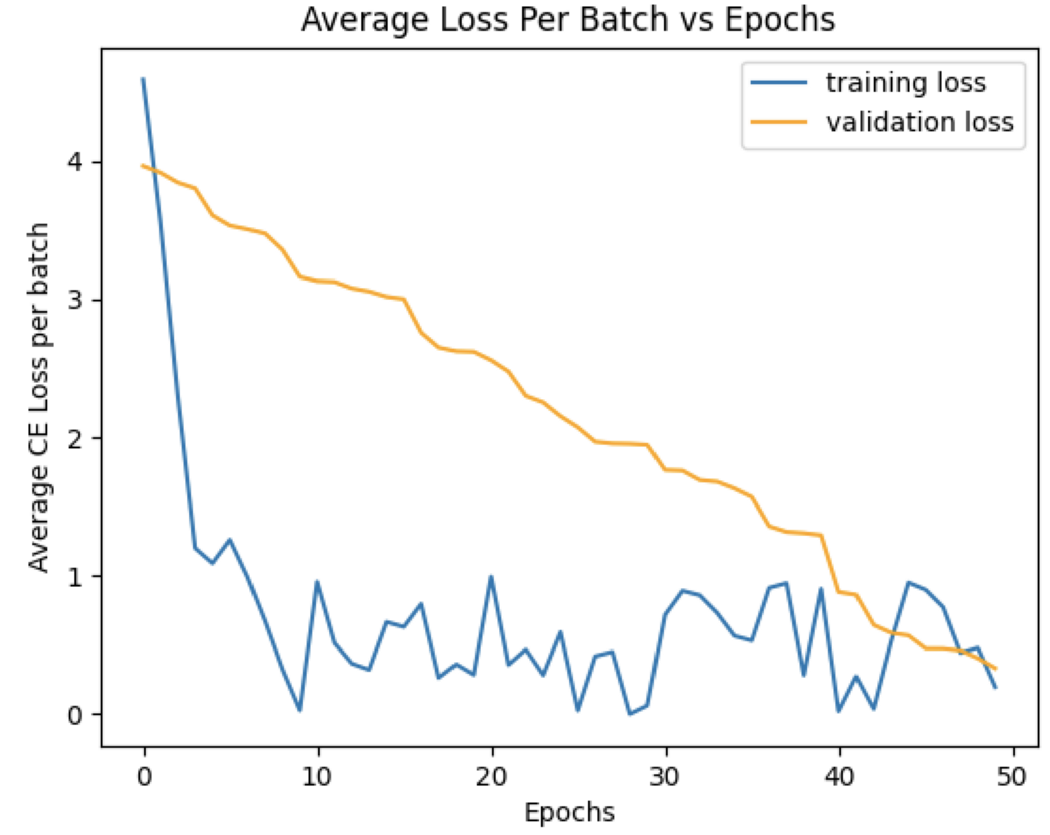
Overall, test documents were able to be read fairly well. The test documents were read with an average character error of 0.17. For comparison, when trying with a CRNN approach, the character error was 1.16. For reference, if the model had output the word “Hyundai” when the label was “Honda,” the character error would be 0.6. During classification training, the final average training cross-entropy loss was 0.118, and the final average validation loss was 0.386. However, it should be noted that the data used were either pre-segmented text lines in the case of classification training or documents where text lines were reasonably on level, i.e., parallel to the page and not slanted. The model does not perform as well when the text lines are not on level due to the limitations of the segmentation algorithm.
Links
The Team

Justin Tran
Director
